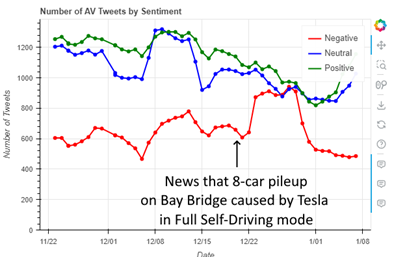
I’ve just completed a side project some may find of interest. It tracks daily sentiment on Twitter concerning automated vehicles and electric vehicles. Early result show the effects of a news reports of a major crash involving a self-driving vehicle on the sentiment regarding AVs expressed on Twitter, as described in Observing the Effect of a Crash on Twitter Sentiment: Early Results from Time Series Data.
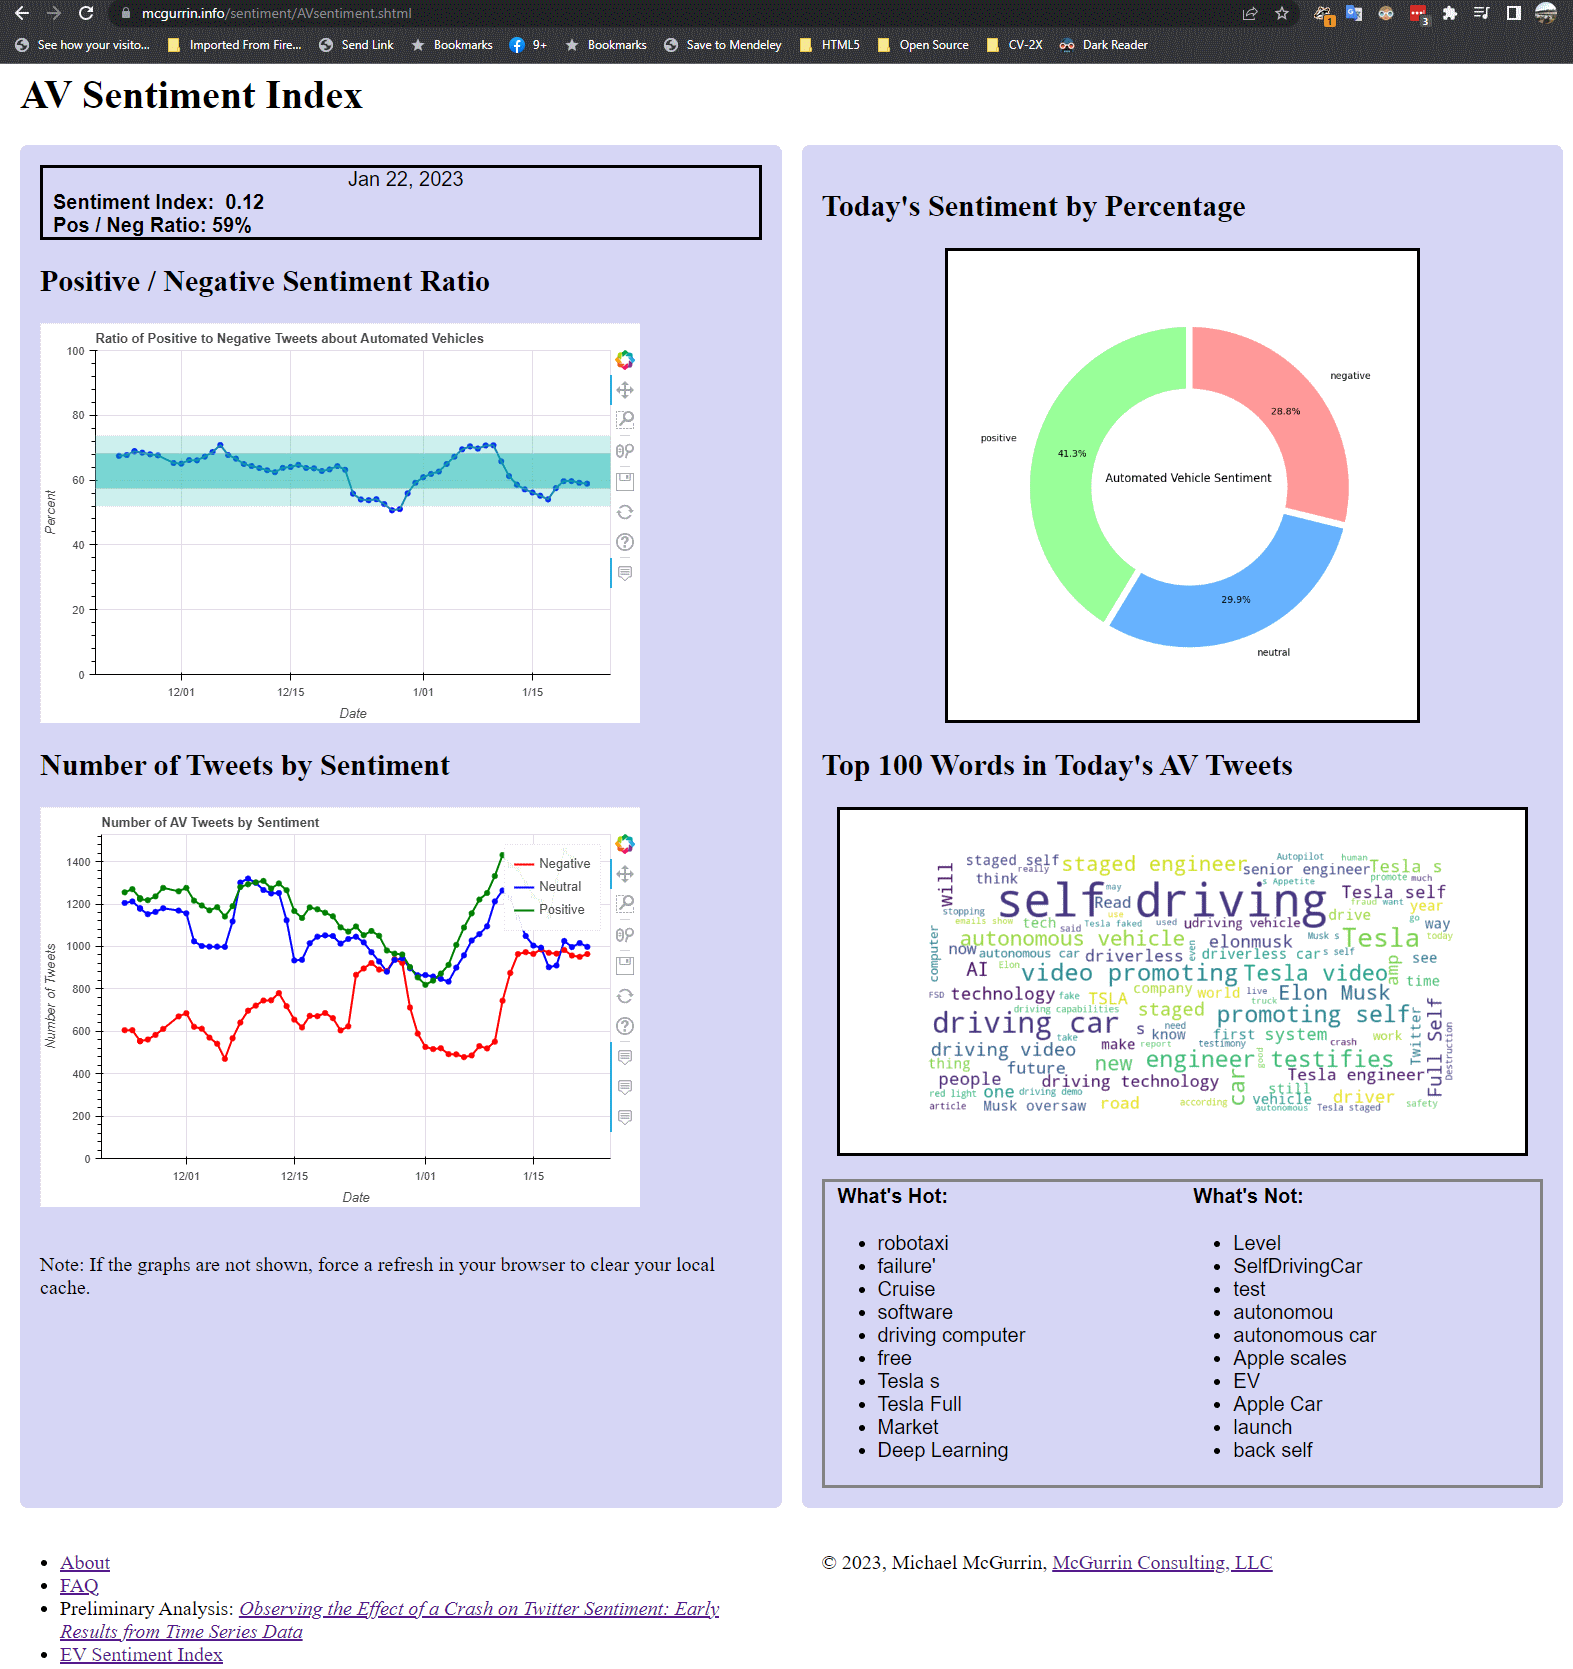
The data is updated daily and displayed on the AV Sentiment Index and EV Sentiment Index web pages. The web pages include the daily sentiment indices, time series plots of the positive / negative sentiment ratio and the number of tweets of each sentiment (positive, negative, and neutral) as well as a word cloud of the most popular 1 and 2 word combinations in the tweets and how they differ from tweets from a week ago.
Please reach out to contact me if you would like more information or to discuss access to the data.